


Movement
MOVE Price
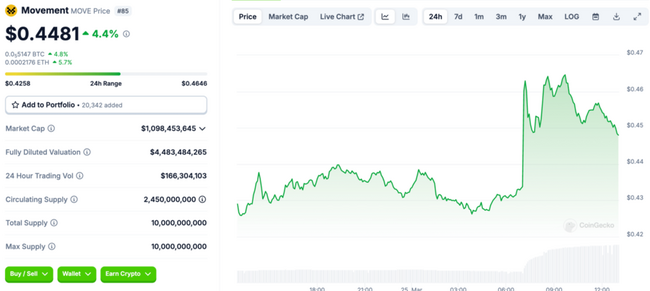
How is the price of Movement (MOVE) calculated?
The price of Movement (MOVE) is calculated in real-time by aggregating the latest data across 68 exchanges and 86 markets, using a global volume-weighted average formula. Learn more about how crypto prices are calculated on CoinGecko.
Movement Price Chart (MOVE)
| 1h | 24h | 7d | 14d | 30d | 1y |
|---|---|---|---|---|---|
| 0.5% | 3.0% | 6.2% | 9.4% | 8.6% | - |
MOVE Converter
|
Market Cap
Market Cap = Current Price x Circulating Supply
Refers to the total market value of a cryptocurrency’s circulating supply. It is similar to the stock market’s measurement of multiplying price per share by shares readily available in the market (not held & locked by insiders, governments) Read More |
$993,226,252 |
|---|---|
|
Market Cap / FDV
The proportion of current market capitalization compares to market capitalization when meeting max supply.
The closer the Mkt Cap/FDV to 1, the closer the current market capitalization to its fully diluted valuation and vice versa. Learn more about Mkt Cap/FDV here. |
0.25 |
|
Fully Diluted Valuation
Fully Diluted Valuation (FDV) = Current Price x Total Supply
Fully Diluted Valuation (FDV) is the theoretical market capitalization of a coin if the entirety of its supply is in circulation, based on its current market price. The FDV value is theoretical as increasing the circulating supply of a coin may impact its market price. Also depending on the tokenomics, emission schedule or lock-up period of a coin's supply, it may take a significant time before its entire supply is released into circulation. Learn more about FDV here. |
$4,053,984,702 |
|
24 Hour Trading Vol
A measure of a cryptocurrency trading volume across all tracked platforms in the last 24 hours. This is tracked on a rolling 24-hour basis with no open/closing times.
Read More |
$67,013,316 |
|
Circulating Supply
The amount of coins that are circulating in the market and are tradeable by the public. It is comparable to looking at shares readily available in the market (not held & locked by insiders, governments).
Read More |
2,450,000,000
|
|
Total Supply
The amount of coins that have already been created, minus any coins that have been burned (removed from circulation). It is comparable to outstanding shares in the stock market.
Total Supply = Onchain supply - burned tokens |
10,000,000,000 |
|
Max Supply
The maximum number of coins coded to exist in the lifetime of the cryptocurrency. It is comparable to the maximum number of issuable shares in the stock market.
Max Supply = Theoretical maximum as coded |
10,000,000,000 |
MOVE Historical Price
| 24h Range | $0.3993 – $0.4231 |
|---|---|
| 7d Range | $0.3993 – $0.5780 |
| All-Time High |
$1.45
72.0%
Dec 10, 2024 (4 months)
|
| All-Time Low |
$0.3783
7.3%
Mar 04, 2025 (27 days)
|
How do you feel about MOVE today?
What is Movement about?
Movement Network is an ecosystem of Modular Move-Based Blockchains that enables developers to build secure, performant, and interoperable blockchain applications, bridging the gap between Move and EVM ecosystems. Movement Network is the first Move-EVM L2 for Ethereum, alongside open-source tooling and protocols to facilitate the adoption of the Move programming language across blockchain ecosystems.
What makes Movement unique?
With Movement, developers can launch high-performance Move VM rollups with ease.
What's the history of Movement?
Backed by Polychain Capital, Binance Labs, Hack VC, Placeholder, and Archetype, Movement Labs revolutionizes blockchain interoperability and advances Move-based technologies in the Web3 space.
Where can you buy Movement?
MOVE tokens can be traded on centralized crypto exchanges. The most popular exchange to buy and trade Movement is Binance, where the most active trading pair MOVE/USDT has a trading volume of $9,038,293.59 in the last 24 hours. Other popular options include HTX and Gate.io.
What is the daily trading volume of Movement (MOVE)?
The trading volume of Movement (MOVE) is $67,013,315.80 in the last 24 hours, representing a 10.80% increase from one day ago and signalling a recent rise in market activity. Check out CoinGecko’s list of highest volume cryptocurrencies.
What is the highest and lowest price for Movement (MOVE)?
Movement (MOVE) reached an all-time high of BTC0.00001500 and an all-time low of BTC0.054421. It’s now trading -72.00% below that peak and 7.30% above its lowest price.
What is the market cap of Movement (MOVE)?
Market capitalization of Movement (MOVE) is BTC12,021.4905 and is ranked #84 on CoinGecko today. Market cap is measured by multiplying token price with the circulating supply of MOVE tokens (2.5 Billion tokens are tradable on the market today).
What is the fully diluted valuation of Movement (MOVE)?
The fully diluted valuation (FDV) of Movement (MOVE) is BTC49,067.3084. This is a statistical representation of the maximum market cap, assuming the maximum number of 10 Billion MOVE tokens are in circulation today. Depending on how the emission schedule of MOVE tokens are designed, it might take multiple years before FDV is realized.
How does the price performance of Movement compare against its peers?
With a price decline of -6.10% in the last 7 days, Movement (MOVE) is outperforming the global cryptocurrency market which is down -6.80%, while outperforming when compared to similar Smart Contract Platform cryptocurrencies which are down -6.60%.
How to add Movement (MOVE) to MetaMask?
Adding Movement (MOVE) to MetaMask allows you to view your token holdings, trade on decentralized exchanges, and more. To add them, you’ll need to import MOVE as a token. You can copy MOVE’s contract address (0x3073f7aaa4db83f95e9fff17424f71d4751a3073) and import it manually, or if you've installed MetaMask's chrome extension, add MOVE to MetaMask with one click on CoinGecko.
Add MOVE to MetaMask.
Movement Markets
| # | Exchange | Pair | Price | Spread | +2% Depth | -2% Depth | 24h Volume | Volume % | Last Updated | Trust Score | |
|---|---|---|---|---|---|---|---|---|---|---|---|
| 1 |
CEX
|
$0.40590966292636630000000000000000 | 0.02% | $157,084 | $520,584 | $9,038,293 | 15.63% |
Recently
|
|||
| 2 |
CEX
|
$0.405649696164514460000000000000000000 | 0.06% | $378,170 | $483,762 | $6,769,207 | 11.7% |
Recently
|
|||
| 3 |
CEX
|
$0.40472780120975880000000000000000000 | 0.02% | $90,398 | $116,565 | $2,368,304 | 4.09% |
Recently
|
|||
| 4 |
CEX
|
$0.40595962716912580000000000000000000 | 0.04% | $313,868 | $344,739 | $3,867,982 | 6.68% |
Recently
|
|||
| 5 |
CEX
|
$0.40690894816252180000000000000000 | 0.02% | $322,343 | $423,447 | $1,892,670 | 3.27% |
Recently
|
|||
| 6 |
CEX
|
$0.405465516503218660000000000000000 | 0.1% | $746 | $33,624 | $6,753,739 | 11.67% |
Recently
|
|||
| 7 |
CEX
|
$0.4058049373384403000000000000000000 | 0.05% | $65,197 | $90,671 | $3,279,181 | 5.67% |
Recently
|
|||
| 8 |
CEX
|
$0.4057049607586575000000000000000000 | 0.02% | $403,932 | $275,986 | $1,092,097 | 1.89% |
Recently
|
|||
| 9 |
CEX
|
$0.40560987735551970000000000000000 | 0.07% | $278,896 | $63,736 | $2,417,473 | 4.18% |
Recently
|
|||
| 10 |
CEX
|
$0.410432824947650900000000000000000000000000000 | 0.17% | $72,676 | $72,198 | $3,246,654 | 5.61% |
Recently
|
|||


Movement Latest News


You may be interested in these crypto articles


 Or check it out in the app stores