


Grin
GRIN Price
How is the price of Grin (GRIN) calculated?
The price of Grin (GRIN) is calculated in real-time by aggregating the latest data across 4 exchanges and 6 markets, using a global volume-weighted average formula. Learn more about how crypto prices are calculated on CoinGecko.
Grin Price Chart (GRIN)
| 1h | 24h | 7d | 14d | 30d | 1y |
|---|---|---|---|---|---|
| 0.6% | 4.5% | 4.7% | 11.3% | 24.4% | 74.8% |
GRIN Converter
|
Market Cap
Market Cap = Current Price x Circulating Supply
Refers to the total market value of a cryptocurrency’s circulating supply. It is similar to the stock market’s measurement of multiplying price per share by shares readily available in the market (not held & locked by insiders, governments) Read More |
$2,819,992 |
|---|---|
|
Market Cap / FDV
The proportion of current market capitalization compares to market capitalization when meeting max supply.
The closer the Mkt Cap/FDV to 1, the closer the current market capitalization to its fully diluted valuation and vice versa. Learn more about Mkt Cap/FDV here. |
1.0 |
|
Fully Diluted Valuation
Fully Diluted Valuation (FDV) = Current Price x Total Supply
Fully Diluted Valuation (FDV) is the theoretical market capitalization of a coin if the entirety of its supply is in circulation, based on its current market price. The FDV value is theoretical as increasing the circulating supply of a coin may impact its market price. Also depending on the tokenomics, emission schedule or lock-up period of a coin's supply, it may take a significant time before its entire supply is released into circulation. Learn more about FDV here. |
$2,819,992 |
|
24 Hour Trading Vol
A measure of a cryptocurrency trading volume across all tracked platforms in the last 24 hours. This is tracked on a rolling 24-hour basis with no open/closing times.
Read More |
$10,480.27 |
|
Circulating Supply
The amount of coins that are circulating in the market and are tradeable by the public. It is comparable to looking at shares readily available in the market (not held & locked by insiders, governments).
Read More |
195,427,020 |
|
Total Supply
The amount of coins that have already been created, minus any coins that have been burned (removed from circulation). It is comparable to outstanding shares in the stock market.
Total Supply = Onchain supply - burned tokens |
195,427,020 |
|
Max Supply
The maximum number of coins coded to exist in the lifetime of the cryptocurrency. It is comparable to the maximum number of issuable shares in the stock market.
Max Supply = Theoretical maximum as coded |
∞ |
GRIN Historical Price
| 24h Range | $0.01370 – $0.01594 |
|---|---|
| 7d Range | $0.01334 – $0.01557 |
| All-Time High |
$25.09
99.9%
Jan 17, 2019 (about 6 years)
|
| All-Time Low |
$0.01333
8.3%
Mar 31, 2025 (1 day)
|
How do you feel about GRIN today?
What is Grin about?
Grin is a private and lightweight open-source project based on the MimbleWimble blockchain implementation. The MimbleWimble protocol was proposed by an anonymous author, Tom Elvis Jedusor, in July 2016. It has garnered significant attention for its potential in enhancing privacy and scalability in blockchain technology.
What makes Grin unique?
Grin differs from Bitcoin and Ethereum by not using addresses. Transactions require both wallets to communicate online, with results broadcasted to the network. Additionally, transaction history, including sender, receiver, and amount, is not recorded on the blockchain. This design keeps the blockchain lightweight, allowing new nodes to join without downloading large amounts of data. Grin was launched without an ICO, fundraising, or pre-mine, with developers contributing openly to ensure fair coin distribution.
What's the history of Grin?
Grin's mainnet launched on January 15, 2019, making it available for mining and trading. The project is based on the MimbleWimble protocol, which was proposed in 2016 by an anonymous author using the pseudonym Tom Elvis Jedusor, inspired by Harry Potter.
What's next for Grin?
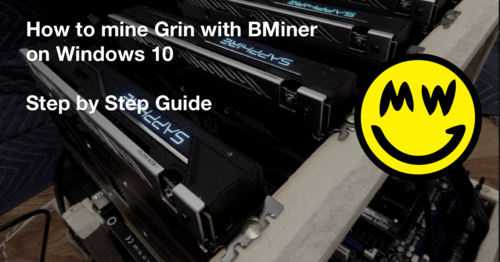
Grin continues to evolve with contributions from developers worldwide, focusing on maintaining fair distribution and improving the network's efficiency. The use of two hashing algorithms, Cuckoo-29 for GPU mining and Cuckoo-31 for ASIC mining, is a deliberate design choice to encourage a transition to ASIC mining for efficiency while keeping the process fair during the initial launch phase.
What can Grin be used for?
Grin can be used for private and lightweight transactions. Two popular wallets are available for interacting with the Grin network: the Grin core wallet and Wallet713. These wallets enable users to send and receive Grin coins efficiently. The Grin network is supported by a proof-of-work consensus algorithm using the Cuckoo Cycle, which is designed to be energy-efficient and secure.
Where can you buy Grin?
GRIN tokens can be traded on centralized crypto exchanges. The most popular exchange to buy and trade Grin is Gate.io, where the most active trading pair GRIN/USDT has a trading volume of $6,223.28 in the last 24 hours. Other popular options include TradeOgre and Bibox.
What is the daily trading volume of Grin (GRIN)?
The trading volume of Grin (GRIN) is $10,480.27 in the last 24 hours, representing a 3.10% increase from one day ago and signalling a recent rise in market activity. Check out CoinGecko’s list of highest volume cryptocurrencies.
What is the highest and lowest price for Grin (GRIN)?
Grin (GRIN) reached an all-time high of BTC0.006971 and an all-time low of BTC0.061600. It’s now trading -99.90% below that peak and 8.30% above its lowest price.
What is the market cap of Grin (GRIN)?
Market capitalization of Grin (GRIN) is BTC33.2321 and is ranked #2343 on CoinGecko today. Market cap is measured by multiplying token price with the circulating supply of GRIN tokens (200 Million tokens are tradable on the market today).
What is the fully diluted valuation of Grin (GRIN)?
The fully diluted valuation (FDV) of Grin (GRIN) is BTC33.2321. This is a statistical representation of the maximum market cap, assuming total number of 200 Million ETH tokens are in circulation today.
How does the price performance of Grin compare against its peers?
With a price decline of -4.70% in the last 7 days, Grin (GRIN) is underperforming the global cryptocurrency market which is down -3.90%, while underperforming when compared to similar Smart Contract Platform cryptocurrencies which are down -4.60%.
Grin Markets
| # | Exchange | Pair | Price | Spread | +2% Depth | -2% Depth | 24h Volume | Volume % | Last Updated | Trust Score | |
|---|---|---|---|---|---|---|---|---|---|---|---|
| 1 |
CEX
|
$0.014409965971855395000000000000000000 | 1.58% | $1 | $14 | $6,223.00 | 59.38% |
Recently
|
|||
| 2 |
CEX
|
$0.0150005553215630610000000000000000 | 6.66% | $0 | $0 | $61.00 | 0.58% |
Recently
|
|||
| 3 |
CEX
|
$0.01430005395688126200000000000000000 | 1.38% | $1 | $1,516 | $3,535.00 | 33.73% |
Recently
|
According to this report, users claim to face difficulties withdrawing their funds from the exchange. Please exercise caution and DYOR when interacting with the exchange platform.
|
||
| 4 |
CEX
|
$0.0152726786876715060 | 10.53% | $0 | $0 | $661.00 | 6.31% |
Recently
|
|||
| 5 |
CEX
|
$0.030293583360600895000000000000000000 | 0.33% | $3 | $53 | $0.00 | 0.01% |
3 days ago
Inactive - No trades in the last 3 hours
Anomaly - Trading price or volume is an outlier against the average
|
- | ||
| 6 |
CEX
|
$0.0299133288741886000 | 27.66% | $0 | $0 | $0.00 | 0.0% |
3 days ago
Inactive - No trades in the last 3 hours
Anomaly - Trading price or volume is an outlier against the average
|
- | ||


You may be interested in these latest crypto news


Grin Guides


 Or check it out in the app stores