

Rainbow Bridged USDC (Near)
USDC.E Price
How is the price of Rainbow Bridged USDC (Near) (USDC.E) calculated?
The price of Rainbow Bridged USDC (Near) (USDC.E) is calculated in real-time by aggregating the latest data across 1 exchanges and 7 markets, using a global volume-weighted average formula. Learn more about how crypto prices are calculated on CoinGecko.
Rainbow Bridged USDC (Near) Price Chart (USDC.E)
| 1h | 24h | 7d | 14d | 30d | 1y |
|---|---|---|---|---|---|
| - | - | - | - | - | - |
USDC.E Converter
|
Market Cap
Market Cap = Current Price x Circulating Supply
Refers to the total market value of a cryptocurrency’s circulating supply. It is similar to the stock market’s measurement of multiplying price per share by shares readily available in the market (not held & locked by insiders, governments) Read More |
- |
|---|---|
|
Fully Diluted Valuation
Fully Diluted Valuation (FDV) = Current Price x Total Supply
Fully Diluted Valuation (FDV) is the theoretical market capitalization of a coin if the entirety of its supply is in circulation, based on its current market price. The FDV value is theoretical as increasing the circulating supply of a coin may impact its market price. Also depending on the tokenomics, emission schedule or lock-up period of a coin's supply, it may take a significant time before its entire supply is released into circulation. Learn more about FDV here. |
- |
|
24 Hour Trading Vol
A measure of a cryptocurrency trading volume across all tracked platforms in the last 24 hours. This is tracked on a rolling 24-hour basis with no open/closing times.
Read More |
$7,918.95 |
|
Circulating Supply
The amount of coins that are circulating in the market and are tradeable by the public. It is comparable to looking at shares readily available in the market (not held & locked by insiders, governments).
Read More |
- |
|
Total Supply
The amount of coins that have already been created, minus any coins that have been burned (removed from circulation). It is comparable to outstanding shares in the stock market.
Total Supply = Onchain supply - burned tokens |
- |
USDC.E Historical Price
| 24h Range | - – - |
|---|---|
| 7d Range | $0.9590 – $1.02 |
| All-Time High |
$1.56
Apr 04, 2024 (12 months)
|
| All-Time Low |
$0.7579
Jan 03, 2024 (about 1 year)
|
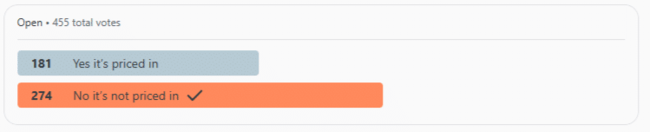
How do you feel about USDC.E today?
Where can you buy Rainbow Bridged USDC (Near)?
USDC.E tokens can be traded on decentralized exchanges. The most popular exchange to buy and trade Rainbow Bridged USDC (Near) is Rhea Finance, where the most active trading pair USDC.E/WNEAR has a trading volume of $7,268.19 in the last 24 hours.
What is the daily trading volume of Rainbow Bridged USDC (Near) (USDC.E)?
The trading volume of Rainbow Bridged USDC (Near) (USDC.E) is $7,918.95 in the last 24 hours, representing a 0.00% increase from one day ago and signalling a recent rise in market activity. Check out CoinGecko’s list of highest volume cryptocurrencies.
What is the highest and lowest price for Rainbow Bridged USDC (Near) (USDC.E)?
Rainbow Bridged USDC (Near) (USDC.E) reached an all-time high of BTC0.00004143 and an all-time low of BTC0.059008. It’s now trading -34.70% below that peak and 34.60% above its lowest price.
How does the price performance of Rainbow Bridged USDC (Near) compare against its peers?
With a price increase of 0.00% in the last 7 days, Rainbow Bridged USDC (Near) (USDC.E) is outperforming the global cryptocurrency market which is down -3.90%, while underperforming when compared to similar Near Protocol Ecosystem cryptocurrencies which are up 0.30%.
Rainbow Bridged USDC (Near) Markets
| # | Exchange | Pair | Price | Spread | +2% Depth | -2% Depth | 24h Volume | Volume % | Last Updated | Trust Score | |
|---|---|---|---|---|---|---|---|---|---|---|---|
| 1 |
DEX
|
$1.01 | - | - | - | $7,268.00 | 92.48% |
1 day ago
Inactive - No trades in the last 3 hours
|
- | ||
| 2 |
DEX
|
$0.000042985774533451230000000000000000000000000000000 | - | - | - | $590.00 | 7.52% |
1 day ago
Inactive - No trades in the last 3 hours
|
- | ||
| 3 |
DEX
|
$1.44 | - | - | - | $4.00 | 0.06% |
3 days ago
Inactive - No trades in the last 3 hours
|
- | ||
| 4 |
DEX
|
$0.072689170144995860000000000000000000000000000000 | - | - | - | $1.00 | 0.01% |
2 days ago
Inactive - No trades in the last 3 hours
|
- | ||
| 5 |
DEX
|
$1.00 | - | - | - | $0.00 | 0.0% |
3 days ago
Inactive - No trades in the last 3 hours
|
- | ||
| 6 |
DEX
|
$1.00 | - | - | - | $0.00 | 0.0% |
5 days ago
Inactive - No trades in the last 3 hours
|
- | ||
| 7 |
DEX
|
$1.03 | - | - | - | $0.00 | 0.01% |
1 day ago
Inactive - No trades in the last 3 hours
Anomaly - Trading price or volume is an outlier against the average
|
- | ||

You may be interested in these latest crypto news


You may be interested in these crypto articles


 Or check it out in the app stores